92% of manufacturers surveyed in Vention’s 2025 Manufacturing Automation Report consider automation critical for their long-term competitiveness. Yet only 37% of businesses have successfully scaled it. Pinpointing the exact issues that limit automation is essential for manufacturing teams trying to scale up.
This is why Vention is launching the Automation Maturity Assessment (AMA). The AMA is a diagnostic framework designed to assess not only which automation technology an organization has deployed, but how consistently it governs, funds, scales, and sustains automation across the enterprise. It is benchmarked across six dimensions and five maturity levels ranging from ad hoc to optimized.
This article explains how the AMA measures automation performance, helping unlock opportunities for wide-scale value creation.
Why Manufacturing Teams Need a Structured Assessment
When automation projects underperform, a cursory analysis tends to surface explanations such as misaligned expectations, prioritizing the wrong automation opportunities, and challenges navigating the change management process.
These observations, while valid, describe only the symptoms rather than systemic causes of underperformance. Without a structured way to evaluate how automation is governed, funded, and scaled, this analysis remains reactive and incomplete.
In many organizations, the ability to uncover the true automation challenges is further constrained by a ‘tribal knowledge trap’. Critical insights about why a project succeeded or failed often reside with a small number of individuals, at specific sites. That knowledge is rarely documented, compared with industry peers, or visible at the enterprise level. As a result, the same issues recur across facilities, even when teams believe they are learning from past deployments.
Without a structured maturity framework, automation results tend to plateau. Organizations may make progress through pilots and isolated deployments, but struggle to translate those wins into a repeatable, enterprise-wide capability. This stagnation typically manifests in three ways:
-
Redundancy: Sites independently solve identical problems using different vendors, architectures, and toolchains, increasing total cost of ownership and limiting reuse.
-
Safety and compliance gaps: Functional safety is treated as a vendor responsibility rather than an internal engineering discipline, with limited enterprise-wide validation against standards such as ISO 13849 and IEC 61508.
-
Ad hoc and inefficient capital allocation: Automation is funded through one-off capital requests that are not sequenced into a broader roadmap and are not explicitly tied to EBITDA reduction or long-term operating targets.
A structured automation maturity assessment addresses these issues by creating a common framework that replaces anecdotal explanations with actionable evidence. This creates an effective shared language across engineering, operations, and finance.
Most importantly, it enables the shift from a run-to-failure automation mindset to a reliability-driven program. Performance, economics, and risk are managed deliberately rather than inferred after the fact.
How the AMA Helps Find a Structured Path to Scaling Automation
As an automation platform used by over 4,000 factories worldwide, Vention has developed a consistent methodology for evaluating automation maturity. This methodology is grounded in direct experience across thousands of deployments, where the same patterns of success and underperformance repeatedly emerged across industries and use cases.
Built on these insights, the AMA codifies recurring patterns into a structured diagnostic framework, designed to help manufacturers understand not just what they have automated, but how effectively their organizations support, scale, and sustain automation over time. The AMA is structured across six dimensions below, each comprising multiple capability questions.
Team and Organization
Uncovers how automation responsibility is organized across the enterprise. It helps determine whether automation is treated as a local, site-led activity or supported by a coherent organizational structure with clear ownership, defined roles, and durable in-house capability.
Project Execution
Examines how automation projects are actually delivered. It focuses on leadership alignment, delivery discipline, cross-functional coordination, vendor governance, and functional safety practices as they are applied from concept through ramp-up.
Technology Maturity
Evaluates how standardized, integrated, and adaptable the automation technology stack is across facilities. It highlights whether systems are designed as isolated solutions or as part of a shared infrastructure supported by common toolchains and software orchestration.
Knowledge and Standards
Helps visualize how automation knowledge is captured and reused. It looks at how code, configurations, standards compliance, and change history are managed over time and shared across sites.
Strategy and Economics
Focuses on how automation investments are prioritized, funded, and evaluated financially. It connects roadmapping, portfolio management, business case rigor, total cost of ownership, and the link to operating and EBITDA targets.
Project Performance
Considers outcomes across the portfolio. It captures how consistently projects achieve throughput, uptime, schedule, budget, and payback targets, and whether systems remain in sustained use after go-live.
How to Read Automation Maturity Assessment Results
Once the assessment is completed, responses across all sections are scored using consistent behavioral criteria. The aggregate of the scores in each category determines the current maturity level and defines the next stage of evolution.
Maturity Levels Based on the Score
| 0-20% | Reactive: Projects are reactive, with no explicit standards, relying on informal anecdotes and minimal KPIs |
| 21%-40% | Emerging: A working group is established to create starter standards and standardize ROI/NPV models |
| 41%-60% | Developing: A central Automation CoE is formed to publish formal standards and industrialize the platform |
| 61%-80% | Scaling: Delivery is federated with CoE guardrails, using modular components and dynamic funding |
| 81%-100% | Leading: Automation operates with a product mindset, self-serve platforms, and closed-loop economics |
Apart from the maturity level, AMA also helps visualize strengths across each dimension through a radar profile.
Reading the Radar Profile
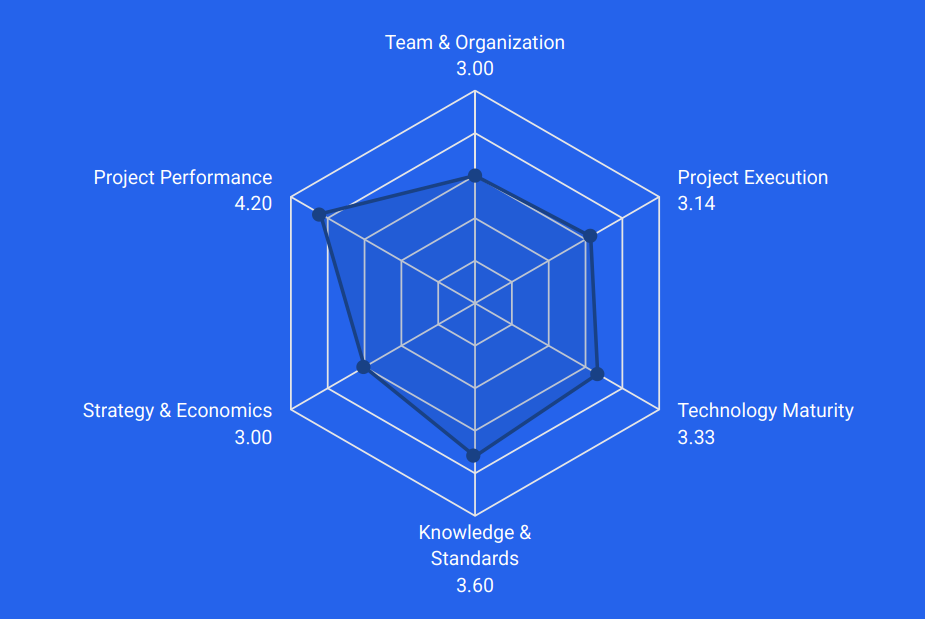
One of the biggest benefits of taking the AMA is being able to benchmark automation maturity against peers. The radar profile puts various dimensions in perspective, helping zero in on key growth areas.
The geometry of the radar chart also offers other insights to enrich enterprise automation plans. A relatively even profile suggests that governance, execution, technology, and economics are developing at a similar pace. An uneven profile points to specific constraints that will limit the organization’s ability to scale automation, even if individual projects are performing well.
Common Organizational Archetypes
While every organization is unique, assessment results tend to cluster into a small number of recognizable patterns. These archetypes help teams quickly interpret what the results imply for next steps.
Strong Execution, Limited Scale
Organizations in this category score well on Project Execution and Project Performance, but lag on Technology Maturity and Knowledge and Standards. Projects are delivered reliably, but toolchains, platforms, and intellectual property are fragmented. The primary constraint is not execution capability, but the lack of a standardized foundation to support reuse and expansion.
Advanced Technology, Unclear Economics
These organizations score highly on Technology Maturity, often deploying advanced automation and robotics across multiple sites. However, Strategy and Economics scores remain low. Financial models are inconsistent, benefits are difficult to validate, and automation struggles to compete for capital. The assets perform, but value is not clearly demonstrated.
Isolated Excellence
Results show pockets of high performance at the site level, often driven by strong local teams. Team and Organization and Knowledge and Standards scores are low, reflecting limited transfer of expertise across the enterprise. Success depends on individuals rather than systems, making results difficult to sustain as the organization grows.
Enterprise Aligned and Scaling
Organizations in this category show balanced scores across most areas, with clear governance, standardized delivery, and strong linkage between automation outcomes and financial targets. Automation functions as a managed program rather than a collection of projects. These organizations are positioned to scale with lower risk and increasing returns.
Progressing to the Next Stage in Automation Maturity
Beyond individual assessment, the AMA establishes industry-wide benchmarks that identify critical gaps in automation maturity. Current data reveals three dimensions where most organizations struggle: ad hoc project planning, lack of cohesive strategy, and limited technological maturity.
Addressing these challenges requires replacing isolated tiger teams with formal automation portfolio management, building a center of excellence to centralize governance, and adopting platforms capable of supporting emerging technologies.
However, before implementing these tactical changes, organizations must first develop the strategic rigor to view automation as a comprehensive roadmap through the lens of economic relevance. This fundamental shift in mindset enables a more deliberate automation strategy that delivers scalable value over time.
Ready to evaluate your automation maturity? Begin your assessment now to understand your automation profile and make informed decisions.